I have been promising these for a while – but between Christmas and moving (who, exactly, decided that was a good idea, hm Sarah?), it got a little delayed. But I promise it was worth the wait! Before we get to the pretty, pretty graphs, a few important caveats:
- If you have no idea what Pitch Wars is, you may want to start here.
- There were 679 unique entries. 617 authors filled out the survey (which you can see here if you’re interested in how the questions were asked).
- For the 68 entries without a completed survey, the only data collected (manually, by me) was: category, word count, genre, personalization of queries (y/n), how many mentors were submitted to, how many mentors requested pages, and query faux pas.
- I did my very best to make sure the data I collected and present below was accurate. Of course, I’m human, and I may have made a few mistakes here and there. If you see something that looks off, please let me know gently.
- Please note when units are in numbers and percentages. All comparisons are made in percentages of known data (i.e. excluding entries where the value for that particular question is unknown.)
- When I say “picks,” this includes all picks and alternates.
- Please also note that anytime a number is given for all applicants (including in comparisons), these results include the picks.
- If you haven’t already, you should probably read the stats post I did for only the queries I received. It included some discussion on genre and comp titles that isn’t possible for a data pool of this size.
- I’ve been asked how much of my time was put into these stats. I would guess somewhere around 30-35 hours. With that in mind, I hope you’ll allow me one teensy shameless self-promo: my Olympic Games sexy romance collection Love and Other Games is only 99 cents for a limited time. Link in the sidebar, if you’re interested.
Overall Entries

No big surprises there, I think? One gentlemen wanted to know how outnumbered were the men, exactly?

That’s 85% female and 14% male. Later, you will see how this was distributed in each category. Care to guess which category had the most male authors?
Since it’s not obvious by looking at it, the next graph shows how many applicants submitted to 4 mentors, 3 mentors, and so on.

I thought it might be interesting to see how many of our applicants have been published before – and how.

Now the question (which I will answer later) becomes: were previously-published applicants more likely to snag a mentor?

There were many applicants who have been published in short fiction and short non-fiction, and those will be included in the “published” slice of the “Submissions by Publishing History” chart.
My friend asked to know the locations of the applicants.

The most-represented states were California (57), New York (43), and Texas (26). No surprises there, as well. What is surprising, however, is how many people who live in Minneapolis insisted on saying that instead of Minnesota, when I specified to put your state if you lived in the US! I’m chalking it up to some extreme city pride. (Please note: UK includes those who indicated they lived in the UK, England and Ireland)

Later, we’ll find out which category’s authors were more likely to interact on twitter!
Middle Grade
Most of the category-specific stats will be presented without commentary.

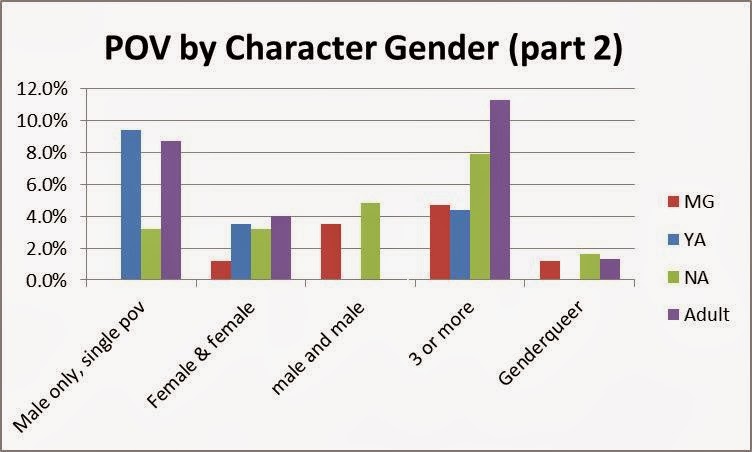
“male & female” indicates an alternating POV between 1 male narrator and 1 female narrator.


Young Adult


First person? Check! And Adult entries are more likely to be told in third person.


It seems one POV is pretty dominant in Middle Grade, but makes up less than half of our adult submissions.
How about POV character genders?

Nearly 60% of the YA entries were told in a single female POV.

Middle Grade entries had the highest percentage of stories told from a single male POV, at 33%. Not surprising, considering…

Update: The above key is incorrect. Female authors are represented by the red color.
There were many more male authors, percentage wise, submitting Middle Grade. And very few submitting New Adult.
Genres
Now I know many of you are just dying to see where the categories stack up in terms of genre. Let me first say, that genre is a hard segment of data to collect. Unlike the stats with my previous post, I simply took the word of the author on their genre, which can be a bit dodgy, as I explained in my previous post. I am also very upset with myself for not including a selection for “paranormal romance.” A few people wrote it in, but I’m sure many more checked the “Urban/Contemporary Fantasy” box instead.
With all that said… here you go 🙂

If you’re interested in a specific genre, please let me know in the comments. I couldn’t make this information very visual if I included all genres. I will add, since it’s useless in all categories except for “adult” that 23 or 14% of the adult entries were Women’s Fiction.
The below chart includes all genres, divided into those that have speculative elements (fantastical or science-fictional) and those that don’t.

It seems speculative fiction is strong in YA and MG, but peters out in NA and Adult.
I asked the authors to identify if their manuscript was any number of things on a long list. These were the most frequently selected.

Here’s a question that could start a twitter gang war. Are the authors in one category more or less likely to commit two Query Faux Pas in their submission?

It seems NA authors are fonder of the rhetorical questions than the others… The question that will be answered later is: does committing one (or both) of these affect your chances of being picked by a mentor?

Please note: “international” means partially or fully taking place in a country outside of those mentioned. A submission could have (and many did) fall in both the “US” and the “imaginary” category (for example: a faerie-underground of Chicago).
Which category’s authors were more likely to chat on twitter about #pitchwars?

It would seem MG authors are more social, but only by a little.
Presented without comment for any who might be interested:

Diversity
Alright, let’s talk diversity.

“Caucasian only” indicates that every POV character, whether there was one of them or six of them, were identified as white/caucasian/of European descent by their authors. “POC” means at least one of the POV characters was not white. “Caucasian + another race” means at least one of the POV characters was white and at least one of them was not, so these will be included in the “POC” numbers.
Update: POC stats include characters that were at least half of a non-white ethnicity.
Of those POC POV characters, which ethnicities were represented the most?

It seems the NA submissions have a fondness for Hispanic characters.
Now let’s take a look at LBTQ characters in the submissions:

Feel free to discuss in the comments, but keep in mind I have no more information than what is displayed on this chart.
Now on to some of the less-often discussed diversified classes. (Thanks to Marieke Nijkamp for helping me fine-tune some of these questions. All mistakes are mine.)

Please note: I did not attempt to describe “neurodiversity” in my survey, assuming authors would know the term if they were writing a neurodiverse character. Neruodiversity includes: the autism spectrum, ADHD, Dyslexia, Tourette’s and more.

I also did not provide guidance on how to determine if a character has a mental illness. I did, however, answer a question on twitter, indicating that normal grief after a loved one’s death should not be considered a “mental illness” unless it ventured into clinical depression.

Again, I did not provide guidance on the definition of “disabled.”
Now you’re thinking, “Yeah, yeah. This is all well and good, Sarah, but what about the winners?” Wonder no more…
Picks!
As stated above, “picks” include the mentees and the alternates. This includes 151 submissions.

A lot of hopefuls on twitter were having near panic attacks about receiving or not receiving requests for extra pages. The mentors were insisting they not panic, that some picks simply didn’t need extra pages to determine their value. I even pointed out that last year, I picked my mentee solely based on her query and five pages. So, how many applicants did receive requests for extra pages?

Twelve picks were not asked for extra pages. Less than half of all applicants were asked for extra pages.
This was just something I was interested in seeing: How many applicants personalized their queries? And how much of an effect did it have on being picked.

It seems there wasn’t much of an effect and the difference shown here might actually be a bit misleading. I can speak only of my own inbox, but I received many queries that didn’t follow the submission guidelines completely or didn’t follow standard query format (e.g. not telling me what the book was about). None of these were personalized, so … do with that what you will.
We saw above that 37% of applicants had been previously published and wondered if that had an effect on being chosen by a mentor. The answer might surprise you…

However, it seems as if those who mentioned their publishing credits in their query did have a slightly higher chance of being picked.
Finally, we saw how many applicants committed one of two distinct query faux pas and wondered how that might affect their chances…

Thank you
Ok, that’s all I have for you now.
Many thanks to the #pitchwars applicants who filled out the survey! 91% is a super-impressive response rate and I couldn’t have done it without you. Also, many thanks to Brenda Drake and her team for hosting the contest!
If you have any questions that I may be able to answer, please post them in the comments. I’ll answer them if I have the data available.
❤

Very interesting, Sarah. I so appreciate providing this insight. I think in writing, the truth is in the masses…if one or two say something it may or may not have credence, but if a person hears it again and again from a multitude, it's best to pay attention. Truly appreciate your work.
LikeLike
Thank you for sharing this. The stats are interesting, especially since I'm kind of a number/Excel freak. 🙂 Thoughts on query letters are fantastic as well. I'll definitely keep those in mind when making future submissions.
LikeLike
Love reading about your insight into this process, Sarah. Thank you very much for sharing.
LikeLike
Thank you for putting so much work into Pitch Wars! Compiling all this data must have taken a lot of time. I really appreciated reading your results. Thank you!
LikeLike
This was very interesting and illuminating. Thanks for sharing!
LikeLike
I'm kind of embarrassed to admit how excited I was to read this. I love stuff like that! 🙂 Thanks Sarah! And if you do compile the stats for all the submissions I may do a little happy dance and send you chocolate!
LikeLike
Thanks, Sarah. Will you be telling the ones who you think were mislabeled? As I'm one of the people stating magical realism, I would really like to know if you think that's not the case. I find my novel hard to classify, so any insight is greatly appreciated. I'm about 99.9% sure you won't pick me, so that makes me extra eager for any feedback :)Btw, the captcha to post this is really difficult. I've failed 4 times so far… will keep trying!
LikeLike
This is very interesting. Thanks for sending this on. Glad I was one of the LBGT books sent to you!
LikeLike
this. was. AWESOME
LikeLike
Thank you for putting all this together!
LikeLike
Thanks for the hard work putting this together.
LikeLike
You are brilliant! Thanks!
LikeLike
Wow, thanks for your generosity in doing this! I hope the move went well.
LikeLike
Wow. You definitely deserve some self promotion time with all that work you did. Thanks!
LikeLike
The data hound in me is excited by this. Thanks!
LikeLike
So much work involved, but interesting!
LikeLike
Thank you so, so much for putting this information together! Such an interesting way to show the trends. Those query faux pas and the picks/non-picks = fascinating… definitely something to look out for in our letters to agents!
LikeLike
Thank you for all the time and effort it took to produce a statistical picture of this segment of the writing community. The word count range surprised me most! I hope you're settling in after your move. Happy New Year!
LikeLike
That was great. Thank you for all the effort you put into those stats.
LikeLike
This was so cool! Thanks for doing this!
LikeLike
Thanks for providing these stats and for working so hard on this over the holidays! Very interesting!
LikeLike
Fascinating! Thanks, Sarah!
LikeLike
Wow, Sarah! Awesome stats! Thanks so much for sharing.
LikeLike
Really great to have data like this as another way to see our world. Thank you so much for putting in all the time.
LikeLike
Wow, Sarah, you're a beast! I wouldn't have even thought to look at the data in some of the ways you broke it down, yet it was extremely interesting. Thank you so much for doing this!!!!
LikeLike
This si awesome and helpful and wow! Thanks! 🙂
LikeLike
Fantastic post and great information! Thank you for doing this. 🙂
LikeLike
Wow, this is so interesting. I can tell you spent a lot of time putting together these stats. Thank you!
LikeLike